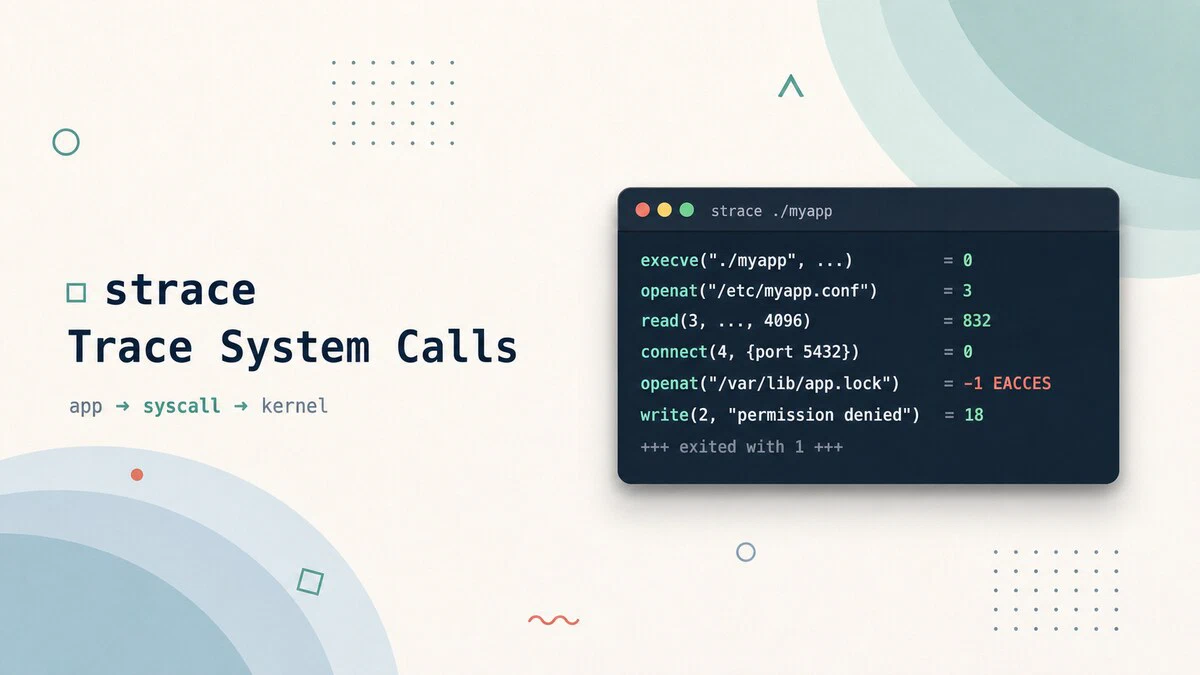
A program exits with a vague error, or hangs, and the logs say nothing useful. Before guessing, you can watch exactly what the program asks the kernel to do. Every time a process opens a file, reads a socket, or allocates memory, it makes a system call, and strace records each one along with its arguments and return value. That trace often reveals the real problem in seconds: a config file the program looked for in the wrong place, a permission denied on a socket, or a call that blocks forever.
This guide explains how to trace a command with strace, attach to a running process, filter the calls you care about, and read the output to find the failing call.
Installing strace
strace is not always installed by default, so add it from your distribution’s repositories.
On Ubuntu, Debian, and Derivatives:
Terminal
sudo apt install straceOn Fedora, RHEL, and Derivatives:
Terminal
sudo dnf install straceTracing a Command
The general syntax is:
txt
strace [OPTIONS] COMMAND [ARGS]The simplest use is to run a command under strace, which prints every system call the program makes to standard error. Trace a small command such as whoami to see the shape of the output:
Terminal
strace whoamioutput
execve("/usr/bin/whoami", ["whoami"], 0x7ffd... /* 25 vars */) = 0
brk(NULL) = 0x55d3...
openat(AT_FDCWD, "/etc/ld.so.cache", O_RDONLY|O_CLOEXEC) = 3
openat(AT_FDCWD, "/lib/x86_64-linux-gnu/libc.so.6", O_RDONLY|O_CLOEXEC) = 3
...
openat(AT_FDCWD, "/etc/passwd", O_RDONLY|O_CLOEXEC) = 3
write(1, "dejan\n", 6) = 6
exit_group(0) = ?
+++ exited with 0 +++
Each line is one system call: the name, its arguments in parentheses, and the return value after the =. A return of 3 from openat is a file descriptor, meaning the open succeeded; a return of -1 carries an error name such as ENOENT. Notice the program opened /etc/passwd to look up the user name, then write sent the result to file descriptor 1, which is standard output.
Reading Failed Calls
The reason to reach for strace is usually a failure, and failures are easy to spot because the return value is -1 followed by the error code. Suppose a program cannot start and you trace it:
Terminal
strace ./myappA failing line looks like this:
output
openat(AT_FDCWD, "/etc/myapp/config.yaml", O_RDONLY) = -1 ENOENT (No such file or directory)This single line tells you the program expected its config at /etc/myapp/config.yaml and the file is not there. A -1 EACCES instead would mean the file exists but the process lacks permission. For a short trace, scan for -1 to find failed calls. With a noisy program, use -Z to print only calls that returned an error:
Terminal
strace -Z ./myappNot every failed call is the root cause. Programs commonly probe several paths before finding a file, so read the calls around the failure and look for the last relevant error before the program exits.
Filtering the Calls You Care About
A full trace is noisy. When you only care about file access, limit the trace to the relevant calls with -e trace=. To see just the file-opening calls, trace openat:
Terminal
strace -e trace=openat ./myappYou can name a category instead of individual calls. The %file category covers every call that takes a filename, and %network covers network-related calls:
Terminal
strace -e trace=%file ./myapp
strace -e trace=%network ./myapp
This focus turns a flood of output into the handful of lines that matter for the question you are asking.
Attaching to a Running Process
When a process is already running, perhaps stuck or pinning the CPU, attach to it by PID with -p instead of starting a new program. First find the PID with the ps command
, then attach:
Terminal
sudo strace -p 2841strace begins printing the calls the live process makes from that moment on. You may not need sudo when the process belongs to your user, but Linux capabilities and the kernel.yama.ptrace_scope setting can impose additional restrictions. Press Ctrl+C to detach and leave the process running. For a hung process, attaching usually shows it parked in a single blocking call such as read or futex, which points straight at what it is waiting for.
Following Child Processes
By default strace follows only the process it started. Programs that fork workers, such as shells or servers, do their real work in children that the trace would miss. Add -f to follow forks so the children are traced too:
Terminal
strace -f ./serverEach line is then prefixed with the PID that made the call, so you can tell the parent and its children apart.
Summarizing System Call Time
Beyond individual calls, strace can profile where a program spends its time in the kernel. The -c flag suppresses the per-call output and prints a summary table when the program exits:
Terminal
strace -c ./myappoutput
% time seconds usecs/call calls errors syscall
------ ----------- ----------- --------- --------- ----------------
41.23 0.004812 18 267 read
22.10 0.002579 10 251 12 openat
15.04 0.001755 14 125 mmap
...
------ ----------- ----------- --------- --------- ----------------
100.00 0.011670 843 14 total
The table ranks system calls by total time, shows how many times each was called, and counts how many returned an error. The 12 openat errors show that some file lookups failed, but programs often probe optional paths as part of normal operation. Inspect the individual calls before treating the count as a problem.
Saving a Trace to a File
Traces scroll fast, so for anything non-trivial write the output to a file with -o and read it afterward:
Terminal
strace -o trace.log -f ./myappThis keeps strace output separate from the program’s own output and gives you a file to grep, for example grep ENOENT trace.log to list every missing-file error at once.
Quick Reference
| Task | Command |
|---|---|
| Trace a command | strace ./app |
| Trace only failed calls | strace -Z ./app |
| Trace only file calls | strace -e trace=%file ./app |
| Trace network calls | strace -e trace=%network ./app |
| Attach to a running process | sudo strace -p PID |
| Follow child processes | strace -f ./app |
| Summarize call time and errors | strace -c ./app |
| Write trace to a file | strace -o trace.log ./app |
Conclusion
Use focused filters and read the calls around a failure instead of treating every error as the cause. For another view of open files and sockets on a running process, use the lsof command
.